SIS - Safety Instrumented Systems - A practical view - Part 3


César Cassiolato
Introduction
The Safety Instrumented Systems are used to monitor the condition of values and parameters of a plant within the operational limits and, when risk conditions occur, they must trigger alarms and place the plant in a safe condition or even at the shutdown condition.
The safety conditions should be always followed and adopted by plants and the best operating and installation practices are a duty of employers and employees. It is important to remember that the first concept regarding the safety law is to ensure that all systems are installed and operated in a safe way and the second one is that instruments and alarms involved with safety are operated with reliability and efficiency.
The Safety Instrumented Systems (SIS) are the systems responsible for the operating safety and ensuring the emergency stop within the limits considered as safe, whenever the operation exceeds such limits. The main objective is to avoid accidents inside and outside plants, such as fires, explosions, equipment damages, protection of production and property and, more than that, avoiding life risk or personal health damages and catastrophic impacts to community. It should be clear that no system is completely immune to failures and, even in case of failure; it should provide a safe condition.
For several years, the safety systems were designed according to the German standards (DIN V VDE 0801 and DIN V 19250), which were well accepted for years by the global safety community and which caused the efforts to create a global standard, IEC 61508, which now works as a basis for all operational safety regarding electric, electronic systems and programmable devices for any kind of industry. Such standard covers all safety systems with electronic nature.
Products certified according to IEC 61508 should basically cover 3 types of failures:
- Random hardware failures
- Systematic failures
- Common causes failures
IEC 61508 is divided in 7 parts, where the first 4 are mandatory and the other 3 act as guidelines:
- Part 1: General requirements
- Part 2: Requirements for E/E/PE safety-related systems
- Part 3: Software requirements
- Part 4: Definitions and abbreviations
- Part 5: Examples of methods for the determination of safety integrity levels
- Part 6: Guidelines on the application of IEC 61508-2 and IEC 61508-3
- Part 7: Overview of techniques and measures
Such standard systematically covers all activities of a SIS (Safety Instrumented System) life cycle and is focused on the performance required from a system, that is, once the desired SIL level (safety integrity level) is reached, the redundancy level and the test interval are at the discretion of who specified the system.
IEC61508 aims at potentializing the improvements of PES (Programmable Electronic Safety, where the PLCs, microprocessed systems, distributed control systems, sensors, and intelligent actuators, etc. are included) so as to standardize the concepts involved.
Recently, several standards on the SIS development, project and maintenance were prepared, as IEC 61508 (overall industries) already mentioned, and is also important to mention IEC 61511, focused on industries with ongoing, liquid, and gas process.
In practice, in several applications it has been seen the specification of equipment with SIL certification to be used in control systems, without safety function. It is also believed that there is a disinformation market, leading to the purchase of more expensive pieces of equipment developed for safety functions where, in practice, they will be used in process control functions, where the SIL certification does not bring the expected benefits, making difficult, inclusive, the use and operation of equipment.
In addition, such disinformation makes users to believe that they have a certified safe control system, but what they have is a controller with certified safety functions.
With the increase of usage and applications with digital equipment and instruments, it is extremely important that professionals involved on projects or daily instrumentation are qualified and have the knowledge on how to determine the performance required by the safety systems, who have domain on calculations tools and risk rates within the acceptable limits.
In addition, it is necessary to:
- Understand the common mode failures, know which types of safe and non-safe failures are possible in a specific system, how to prevent them and, also, when, how, where and which redundancy level is more appropriate for each case.
- Define the preventive maintenance level appropriate for each application.
The simple use of modern, sophisticated or even certified equipment does not absolutely ensure any improvement on reliability and safety of operation, when compared with traditional technologies, except when the system is deployed with criteria and knowledge of advantages and limitations inherent to each type of technology available. In addition, the entire SIS life cycle should be in mind.
Commonly we see accidents related to safety devices bypassed by operation or during maintenance. Certainly it is very difficult to avoid, in the project stage, that one of such devices are bypassed in the future, but by a solid project that better satisfies the operational needs of the safety system user, it is possible to considerably eliminate or reduce the number of non-authorized bypass.
By using and applying techniques with determined or programmable logic circuits, failure-tolerant and/or safe failure, microcomputers and software concepts, today is possible to project efficient and safe systems with costs suitable for such function.
The SIS complexity level depends a lot on the process considered. Heaters, reactors, cracking columns, boilers, and stoves are typical examples of equipment requiring safety interlock system carefully designed and implemented.
The appropriate operation of a SIS requires better performance and diagnosis conditions compared to the conventional systems. The safe operation in a SIS is composed by sensors, logic programmers, processors and final elements designed with the purpose of causing a stop whenever safe limits are exceeded (for example, process variables such as pressure and temperature over the very high alarm limits) or event preventing the operation under unfavorable conditions to the safe operation conditions.
Typical examples of safety systems:Emergency Shutdown System
- Safety Shutdown System
- Safety Interlock System
- Fire and Gas System
We have seen in the previous article, in the second part, some details on the Reliability Engineering. Now we will see, with models using series and parallel systems, fault trees, Markov model and some calculations.
Failure Analysis - Fault Trees
There are some methodologies for failure analysis. One of them, which is very used, is the fault tree analysis (FTA), aiming at improving the reliability of products and processes by a systematic analysis of possible failures and their consequences, instructing on the adoption of corrective or preventive measures.
The fault tree diagram shows the hierarchical relationship between the identified failure modes. The tree construction process begins with the perception or anticipation of a failure, which is then decomposed and detailed to simpler events. Therefore, the fault tree analysis is a top-down technique, as part of the general events that are divided in more specific events.
Following below, an example of a FTA diagram applied to a failure in an electric engine is shown. The initial event, which may be an observed or anticipated failure, is called top event, and is indicated by the blue arrow. From that event, other failures are detailed, until reaching the basic events composing the diagram resolution limit. Failures shown in yellow compose the resolution limit of this diagram.
.bmp)
Figure 1 - FTA Example
It is possible to add logic elements to the diagram, such as “and” and “or” to better describe the relationship between failures. In that way it is possible to use the diagram to estimate the probability of a failure happening as of more specific events. The following example shows a tree applied to the overheating issue in an electric engine using logic elements.
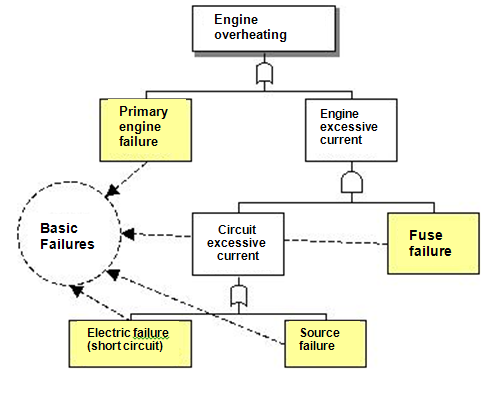
Figure 2 - FTA Example using logic elements
The Fault Tree analysis was developed in the beginning of 1960 by the engineers from Bell Telephone Company.
Logic Symbols used in the FTA
The FTA conduction is the graphic representation of the interrelation between the equipment or operation failures that may result in a specific accident. The symbols shown below are used in the construction of the tree to represent such interrelation.
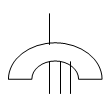 |
“OR” Gate: Indicates that the event output occurs when any type of input occurs. |
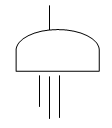 |
“AND” Gate: Indicates that the event output occurs only when a simultaneous input of all events occurs. |
.jpg) |
Inhibition Gate: Indicates that the event output occurs when the input occurs and the inhibiting condition is met. |
.jpg) |
Restriction Gate: Indicates that the event output occurs when the input occurs and the specific delay or restriction time expired. |
.jpg) |
Basic Event: represents the equipment BASIC FAILURE or system failure not requiring other failures or additional defects. |
.jpg) |
INTERMEDIATE EVENT: represents a failure in an event resulting from the interaction with other failures developed by logic inputs as described above. |
.jpg) |
UNDEVELOPED EVENT: represents a failure no longer examined, as the information is no longer available or because the consequences are not significant. |
.jpg) |
EXTERNAL EVENT: Represents a condition or event supposed to exist as a limit condition of the system for analysis. |
.jpg) |
TRANSFERENCES: indicates that the failure tree is developed additionally to other leaves. The transference symbols are identified by number or letters. |
Figure 3 - Logic Symbols used in the FTA
Markov Models
A Markov model is a state diagram where the several failure state of a system is identified. The states are connected by a bow with the failure rates or repair rates leading the system from one state to the other (see figure 4 and figure 5). The Markov models are also known as state space diagrams or state diagrams. The state space is defined as the set of all states where the system can be found.
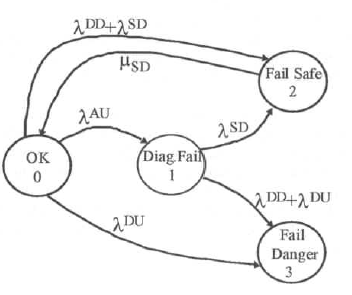
Figure 4 - Example of Markov model
For a specific system, a Markov model consists in a list of all possible states in that system, the possible transition ways between those states, and the failure rates of such transitions. In the transition reliability analysis, usually there are failures and repairs. When graphically representing a Markov model, each state is represented with a “circle, with arrows indicating the transition ways between states, as shown on figure 4.
The Markov method is a useful technique to model the reliability in systems where failures are statistically independent and failure and repair rates are constant.
The state of a component is understood as the set of possible values its parameters can assume. Such parameters are called variables of state and describe the component condition. The state space is the set of all states that a component may present.
The Markov model of a real system usually includes a “full-up” of the state (that is, the state with all operating elements) and a set of intermediate states representing a partial failure condition, leading to the completely in failure state, that is, the state in which the system is incapable of performing its project function. The model can include transition repair ways, as well as the failure transition ways. Overall, each transition way between two states reduces the probability of the state from where it is starting, and increases the probability of the state where it is entering, to an equal rate to the transition parameter multiplied by the current probability of the state of origin.
The overall probability flow in a specific state is the sum of all transition rates for such state, each one multiplied by the state probability in the origin of such transition. The probability of flow output of a specific state is the sum of all transitions leaving a state multiplied by the probability of such state. To exemplify that, the typical input and output flows of a state and of surrounding states are represented in Figure 4.
In such model, all failures are classified as dangerous failures or as safe failures. A dangerous failure is that placing the safety system in a state in which it will not be available to stop the process if that becomes necessary. A safe failure is that leading the system to stop the process in a situation of no danger. The safe failure is usually called false trip or spurious.
The Markov models include diagnosis coverage factors for all components and repair rates. The models consider that non-detected failures will be diagnosed and repaired by periodic proof tests.
Markov models also include failure rates associated with performance failures and common hardware failures.
The system modeling should include all possible types of failures and they can be grouped in two categories:
1) Physical failures
2) Performance failures
Physical failures are those occurring when the function performed by a module, a component, etc, presents a deviation concerning the specified function due to physical degradation.
The physical failures may be failures due to natural aging or failures caused by the environment.
To use physical failures in Markov models, the cause of failures and its effects on the modules, etc, should be determined. Physical failures should be categorized as dependent or independent failures.
Independent failures are those that never affect more than one module, while dependent failures may cause the failure of several modules.
Performance failures are those occurring when the physical equipment is in operation, although without performing the specified function due to a performance deficiency or human error. Examples of performance failures are: safety system project errors, software, hardware connection, human interaction errors and hardware project errors.
In the Markov models, the performance failures are separated in safe and dangerous failures. A safe performance failure is supposed to result in a spurious trip. Similarly, a dangerous performance failure will result in a failure to work state, that is, that failure in which the system will no longer be available to stop the process. The performance failure rate evaluation should take into consideration several possible causes, such as:
1) Safety system project errors
Including logic specification errors of the safety system, inappropriate architecture choice for the system, incorrect selection of sensors and actuators, errors in the interface project between PLCs and sensors and actuators.
2) Hardware implementation errors
Such errors include errors in the sensors and actuators connection to PLCs. The probability of an error increases with the E/S redundancy if the user has to connect each sensor and each actuator to several E/S terminals. The use of redundant sensors and actuators also cause a major probability of connection errors.
3) Software errors
Such errors include the errors in software developed both by the supplier and user. The suppliers’ software usually include an operational system, the E/S routines, application functions and operational language. The supplier software error may be minimized by ensuring a good software project and the compliance with coding procedures and tests. The conduction of independent tests by other companies may also be very useful.
The errors of software developed by the user include application program errors, user interface diagnosis and routines (displays, etc.). Engineers specialized in safety systems software may help minimizing the user software errors. Also, exhausting software tests should also be conducted.
4) Human interaction errors
Here it is included the project and operation errors of the man-machine interface of the safety system, errors made during periodic safety system tests and during the maintenance of defective modules of the safety system. The maintenance errors may be reduced by a good safety system diagnosis identifying the defective module and including failure indicators in the defective modules. It is important to keep in mind that in this point there is no perfect or failure-proof diagnosis.
5) Hardware project errors
Among those errors, it is included the PLCs manufacturing project errors, sensors and actuators, as well as users errors in the safety system and process interface.
In redundant settings of PLCs, sensors and actuators, some performance failures may be reduced by using several hardware and/or software.
Dependent failures should be modeled in a different way, as it is possible that multiple failures occur simultaneously. At the modeling point of view, the dominant dependent failures are failures with a common cause. The common cause failures are the direct result of a common basic cause. An example is the interference of radiofrequency causing the simultaneous failure of multiple modules. The analysis of that kind of failure is very complex and requires a deep knowledge of the system, both in hardware and software level and in the environment.
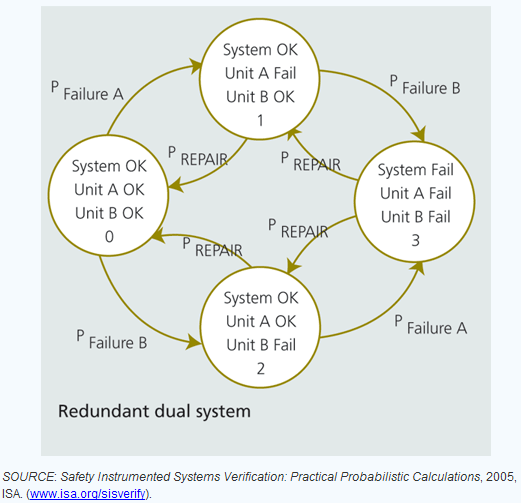
Figure 5 - Example of Markov model in redundant system
Certainly with certified equipment and tools according to IEC 61508 standard the failure rates of products is known, making easier the safety calculations and architectures.
Conclusion
In practical terms, the aim is the reduction of failures and, consequently, the reduction of shutdowns and operational risks. The purpose is to increase the operational availability and also, in terms of processes, the minimization of variability with direct consequence to the profitability increase.
References
- IEC 61508 – Functional safety of electrical/electronic/programmable electronic safety-related systems.
- IEC 61511-1, clause 11, " Functional safety - Safety instrumented systems for the process industry sector - Part 1:Framework, definitions, system, hardware and software requirements", 2003-01
- ESTEVES, Marcello; RODRIGUEZ, João Aurélio V.; MACIEL, Marcos. Safety interlock system, 2003.
- William M. Goble, Harry Cheddie, "Safety Instrumented Systems Verification: Practical Probabilistic Calculation"
- Safety Instrumented Systems - César Cassiolato
- “Reliability in Measurement Systems and Safety Instrumented Systems” - César Cassiolato
- Manual LD400-SIS
- Safety Instrumented Systems – a practical view – Parte 1, César Cassiolato
- Researches on internet
Reliable Solutions